
A break of structure (BOS) happens when price closes beyond the last swing high or swing low, confirming the current trend is likely to continue. We treat a valid BOS as a green light to stay with the trend or to enter with a stop placed beyond the broken level, using it as one input among several, never as a standalone signal.
TL;DR:
- A true break of structure requires a close beyond the swing high or low, followed by immediate follow-through or rejection on retests for confirmation.
- Always confirm the candle close beyond the swing point rather than just wick pokes, and ensure volume or momentum spikes support the break.
- Use a higher timeframe bias, such as the daily or 4-hour chart, to improve the reliability of BOS signals and avoid false breakouts.
- Entry timing can be optimized by waiting for retests and rejections, with stops placed beyond invalidation swings and sizing based on ATR for risk control.
- BOS performs best in liquid, trending markets and can break down during thin sessions or high-impact news, requiring caution and backtesting.
Table of Contents
- What BOS Looks Like: Bullish and Bearish Examples
- BOS vs. ChoCh and MSS: Clear Decision Rules
- How to Validate a Real BOS and Avoid Fakeouts
- Concrete Trade Rules: Entries, Stops, Sizing, and Targets
- Timeframe and Tool Choices That Improve BOS Reliability
- Two Chart Walkthroughs: Continuation and a False Break
- How We Apply BOS to Live Alerts and Coaching
- Where BOS Falls Short
- Try Annotated BOS Signals From Prime Trading Signals
- FAQ
- Sources
What BOS Looks Like: Bullish and Bearish Examples
A swing high is a candle with lower highs on both sides; a swing low is the mirror image. Once you can mark those pivots cleanly, spotting a BOS becomes a matter of watching the close, not the wick.
- Bullish BOS: price prints a higher high, pulls back to a higher low, then closes decisively above the prior higher high.
- Bearish BOS: price prints a lower low, bounces to a lower high, then closes decisively below the prior lower low.
- A wick that pokes through the level without a close beyond it does not count as BOS.
- Watch the candle body relative to the broken level: a strong close well past it carries more weight than a close that barely clears it.
BOS vs. ChoCh and MSS: Clear Decision Rules
ChoCh (change of character) marks the first break against the prevailing trend, often the earliest sign momentum is shifting. MSS (market structure shift) describes the fuller sequence that confirms a reversal is underway, typically a ChoCh followed by a retest and a new swing forming in the opposite direction.
- If price keeps printing higher highs and higher lows, each new break is a continuation BOS.
- If an uptrend suddenly breaks below the most recent higher low, that is a ChoCh, not a BOS.
- Flip your directional bias only once a ChoCh is followed by a retest and a fresh structural swing, which is the MSS confirmation.
How to Validate a Real BOS and Avoid Fakeouts
Plenty of breaks fail within a candle or two, so a short checklist does more for your account than any indicator alone.
- Confirm the candle closes beyond the swing point, not just wicks through it.
- Look for follow-through on the next one or two candles in the same direction.
- Wait for a retest of the broken level that gets rejected, which often offers a cleaner entry than chasing the initial break.
- Check for a volume or momentum surge on the break itself, since genuine structural shifts tend to come with participation, not a quiet drift.
- Confirm the higher timeframe bias agrees with the direction of the break before committing size.
Pro Tip: Treat the retest as your real entry trigger: the initial break tells you where to watch, the retest tells you whether to act.
CME Group’s technical analysis education notes that when price breaks a support or resistance zone it often continues in that direction, and the broken level can flip roles, with former resistance acting as new support. That role reversal is exactly what a retest-and-rejection entry is built on.
Concrete Trade Rules: Entries, Stops, Sizing, and Targets
Turning BOS into a repeatable process means defining your entry, stop, size, and exit before the break happens, not after.
- Break-on-close entry: enter as soon as the candle closes beyond the swing, accepting a wider stop for earlier participation.
- Retest entry: wait for price to return to the broken level and reject it, which usually tightens your stop distance.
- Momentum entry: enter on a strong impulse candle immediately following the break, skipping the retest if momentum looks unlikely to pause.
Place your stop beyond the invalidation swing, or use an ATR multiple if the structure is tight. As an illustrative example only, say a stock trades at $50 with an ATR of $1.20: a stop at 1.5x ATR sits roughly $1.80 away, or $48.20. The SEC’s guidance on day trading risk warns that leverage can amplify losses beyond your initial deposit, which is exactly why sizing off a defined stop distance matters more than picking a round-number position size.
With a $1.80 stop distance, your position size works out to roughly 55 shares ($100 ÷ $1.80). Scale out a portion at the first measured move and trail the remainder behind the next confirmed swing.
Timeframe and Tool Choices That Improve BOS Reliability
Establish bias on the daily or 4-hour chart first, then drop to the 1-hour or 15-minute chart to time entries within that bias. CME Group’s continuation pattern education notes that higher-timeframe alignment materially reduces false signals on a lower timeframe break.
- Use an EMA ribbon (such as the 20/50/200) to gauge whether the broader trend supports the break.
- Lean on ATR to size stops objectively instead of guessing a dollar or pip distance.
- Treat a volume or momentum spike on the break as a secondary filter, not a replacement for the close confirmation.
- When timeframes disagree, favor the higher timeframe’s direction and either wait or reduce size on the lower timeframe trade.
Two Chart Walkthroughs: Continuation and a False Break
Scenario A, bullish continuation: price marks a higher high near $120, pulls back to a higher low at $115, then closes at $123 on strong volume.
- Mark the $120 swing high and the $115 higher low on your chart.
- Wait for the retest of $120 and watch for a rejection wick holding above it.
- Enter on the rejection candle, stop below $115, target the next measured swing.
Scenario B, a deceptive break: price closes just above a swing high, stalls, then slides back below the prior higher low within a few candles. That failure is your cue to cut the long and watch for a ChoCh-based short once price confirms a new lower high and breaks the prior low with a close.
How We Apply BOS to Live Alerts and Coaching
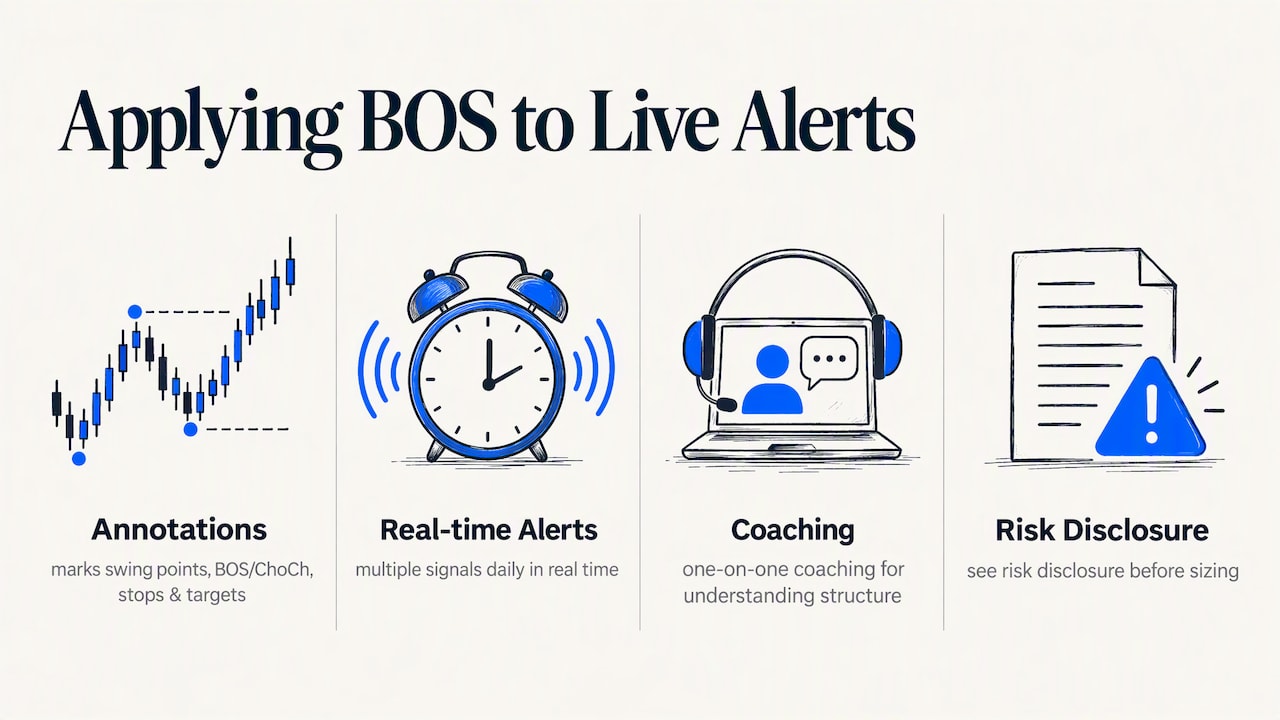
Our signal annotations mark the swing points behind each call so members can see the BOS or ChoCh driving the trade, along with the stop and target levels we use. We send multiple signals daily in real time, backed by one-on-one coaching for members who want to understand the structure behind every call. We always point members to our risk disclosure before sizing a live position.
Where BOS Falls Short
BOS works best in liquid, trending conditions and breaks down around thin sessions or high-impact news, where a close beyond a swing can reverse within minutes. Backtest your rules, practice on a demo account, and keep risk per trade conservative before trusting any single signal.
— sibca
Try Annotated BOS Signals From Prime Trading Signals
Reading structure on your own takes screen time most traders don’t have; our annotated alerts mark the swing points, stops, and targets so you can see the reasoning behind every call. We offer monthly and lifetime forex plans alongside combined crypto and forex options for traders working both markets.

- Forex signals run $49 per month or $149 one-off for the lifetime plan.
- Combined Crypto & Forex access runs $89 per month or $299 one-off for lifetime.
- Start on a demo account, risk a small percentage per trade, and read our risk disclosure before going live.
Check our services page to compare forex, crypto, and combined plans side by side.
FAQ
What makes a valid break of structure?
A valid BOS requires a candle close beyond the prior swing high or low, not just a wick through it, ideally followed by continuation on the next candle or two. A retest that gets rejected at the broken level adds further confirmation and often offers a cleaner entry than the initial break.
What is the 3-5-7 rule in trading?
This refers to a risk management guideline some traders use: capping risk at 3% on any single trade and 5% across open positions in one market. It is a position-sizing framework rather than a structural concept tied specifically to BOS.
How do I trade a break of market structure?
Confirm the close beyond the swing, wait for a retest or follow-through candle, then enter with a stop beyond the invalidation point and size your position based on that stop distance. Align your entry timeframe with a higher-timeframe bias to reduce the odds of trading a short-lived fakeout.
How do I identify BOS and ChoCh?
A BOS continues the existing sequence of higher highs and higher lows (or lower lows and lower highs), while a ChoCh is the first break against that sequence, often the earliest signal of a reversal. Confirming a full market structure shift generally requires a ChoCh plus a retest and a new swing forming in the opposite direction.