
Supply and demand zones are price ranges left behind by heavy institutional buying or selling, and they act as high-probability areas to plan entries, place stops, and manage exits. When combined with confirmation on a lower timeframe, these zones give traders a repeatable framework for spotting where price is likely to pause or reverse.
TL;DR:
- Draw tight zones around three to five candle bases, from the opposing candle’s body extreme to the base’s furthest wick.
- Treat first contact as a watch point, entering only after a lower timeframe reversal candle, rejection wick, or structure break confirms the setup.
- Because leveraged forex losses can exceed the initial deposit, set account risk before entry and size positions around stop distance and zone width.
- Prefer untested zones with sharp departures; downgrade them after repeated retests, especially when arrival volume is weak or market structure conflicts.
- Use zones to trade an impulsive move’s origin, support and resistance for repeatedly tested levels, and fair value gaps for shorter term entries.
Table of Contents
- What supply and demand zones are and how they form
- How to identify and draw supply and demand zones correctly
- Trading rules: entries, confirmation, stops, and position sizing
- Freshness, tests, and confirmation: how reliability decays
- Supply and demand zones versus support/resistance, order blocks, and fair value gaps
- Common mistakes, quick checklist, and risk warnings
- How volume interacts with supply and demand zones
- Integration of supply and demand zones with other technical indicators
- Risk management strategies specific to trading supply and demand zones
- Why trading zones well depends more on discipline than detection
- Where structured signals and coaching fit into zone trading
- FAQ
- Sources
What supply and demand zones are and how they form
A zone starts as a base, a tight period of consolidation where orders quietly build up, and ends with an impulsive departure candle that leaves the range behind. That sharp move is the signature of a real zone: according to Dukascopy Bank’s trading desk, zones form where significant institutional orders were executed, triggering a fast, directional push away from the base.
Traders usually label these patterns by candle sequence:
- Rally-base-rally (RBR): price rallies, pauses, then rallies again, marking a demand zone.
- Drop-base-drop (DBD): price drops, pauses, then drops again, marking a supply zone.
- Rally-base-drop (RBD): a rally stalls and reverses, flagging a supply zone.
- Drop-base-rally (DBR): a decline stalls and reverses, flagging a demand zone.
Zones are ranges, not single lines, because the orders behind them were filled across several price points rather than one tick. That is also what separates them from support and resistance: support and resistance describe levels that get retested many times, while supply and demand zones mark the origin of the move itself.
How to identify and draw supply and demand zones correctly
Start on a higher timeframe and scan for a clean consolidation, usually three to five candles, followed by a sharp, one-directional move away from it. That combination of a tight base and a strong departure leg is what makes a zone worth marking.
- Find the base: a small cluster of candles with overlapping ranges, little progress, and no major directional bias.
- Set the proximal boundary at the body extreme of the last candle opposing the move, since this is the edge price is most likely to reach first.
- Set the distal boundary at the furthest wick of the base, which defines the outer edge of the original order pool.
- Keep the box tight. A wide zone inflates your stop distance and quietly drags down your risk-to-reward on every trade.
- Mark zones on the higher timeframe first, then drop down to a lower timeframe only when price approaches one, to look for an entry trigger.
Pro Tip: Draw fewer, cleaner zones. A chart with three well-defined zones is more useful than one with fifteen overlapping boxes.
Trading rules: entries, confirmation, stops, and position sizing
A marked zone is a hypothesis, not a trade signal. Treat the first touch as an invitation to watch, not to act, and wait for the lower timeframe to confirm before committing capital.
- Confirm with a clear reversal candle, a rejection wick, or a break in short-term structure once price reaches the zone.
- Enter with a limit order at the proximal edge, wait for confirmation and enter on the close, or scale in with partial fills as price works through the range.
- Place stops beyond the distal wick or the nearest structural invalidation point, never inside the zone itself.
- Size the position so that stop distance and zone width define your risk, not the other way around: if the stop needed is too wide, reduce size or skip the setup.
The U.S. Securities and Exchange Commission notes that leveraged forex trading can produce losses larger than the original deposit, since retail forex markets have no central marketplace and prices can move quickly across venues. That single fact is why limit orders and defined stop placement matter more in fast-moving sessions than in calm ones, and why position sizing should always come before entry, not after.
Freshness, tests, and confirmation: how reliability decays
A fresh zone is one that has not been retested since it formed, and it carries the best odds because the original institutional orders are still likely sitting there. According to Dukascopy’s market analysis, each retest consumes part of that liquidity, so a zone touched three times is weaker than one touched once, even if the lines on the chart look identical.
Layer in context before trading a zone: a volume spike on arrival, the session it formed in, and whether it lines up with the broader market structure all raise or lower its quality.
| Factor | Strong zone | Weak zone |
|---|---|---|
| Freshness | Untested | Tested two or more times |
| Formation | Sharp, fast departure | Slow, grinding move |
| Width | Tight, few candles | Wide, sprawling base |
| Context | Aligned with trend/structure | Against prevailing structure |
Supply and demand zones versus support/resistance, order blocks, and fair value gaps
These four concepts overlap but answer different questions. A zone marks where an impulsive move originated; support and resistance mark a level that keeps getting retested regardless of origin. Order blocks largely overlap with supply and demand zones but typically need a confirmed break of structure before a trader treats them as valid. Fair value gaps are the imbalance left inside a move, not at its starting base, so they tend to fill faster and suit more short-term, lower-timeframe trading.
- Use supply and demand zones for swing-level entries built around a clear base and departure.
- Use support and resistance when a level has been tested repeatedly across sessions.
- Use order blocks once structure has broken and you need a tighter entry reference.
- Use fair value gaps for quick, intra-move fills on lower timeframes.
Common mistakes, quick checklist, and risk warnings
The most common error is simply marking too many zones. A cluttered chart makes every pullback look like an opportunity, which defeats the purpose of the concept. The second most common error is entering without confirmation, treating the zone itself as a signal instead of a hypothesis to test.
Low-liquidity sessions and heavy leverage compound both mistakes, since the SEC’s investor bulletin on forex trading points out that thin markets can move fast and leverage magnifies the resulting losses.
- Confirm the timeframe: is this zone relevant to your trading horizon?
- Check freshness: has it been tested before?
- Judge the departure: was the move sharp or sluggish?
- Measure the width: is the stop distance acceptable?
- Look for confirmation: reversal candle, structure break, or volume spike?
- Set your risk: what percentage of your account is on the line?
Pro Tip: Run through this checklist before every entry, not just when a setup looks obvious.
How volume interacts with supply and demand zones
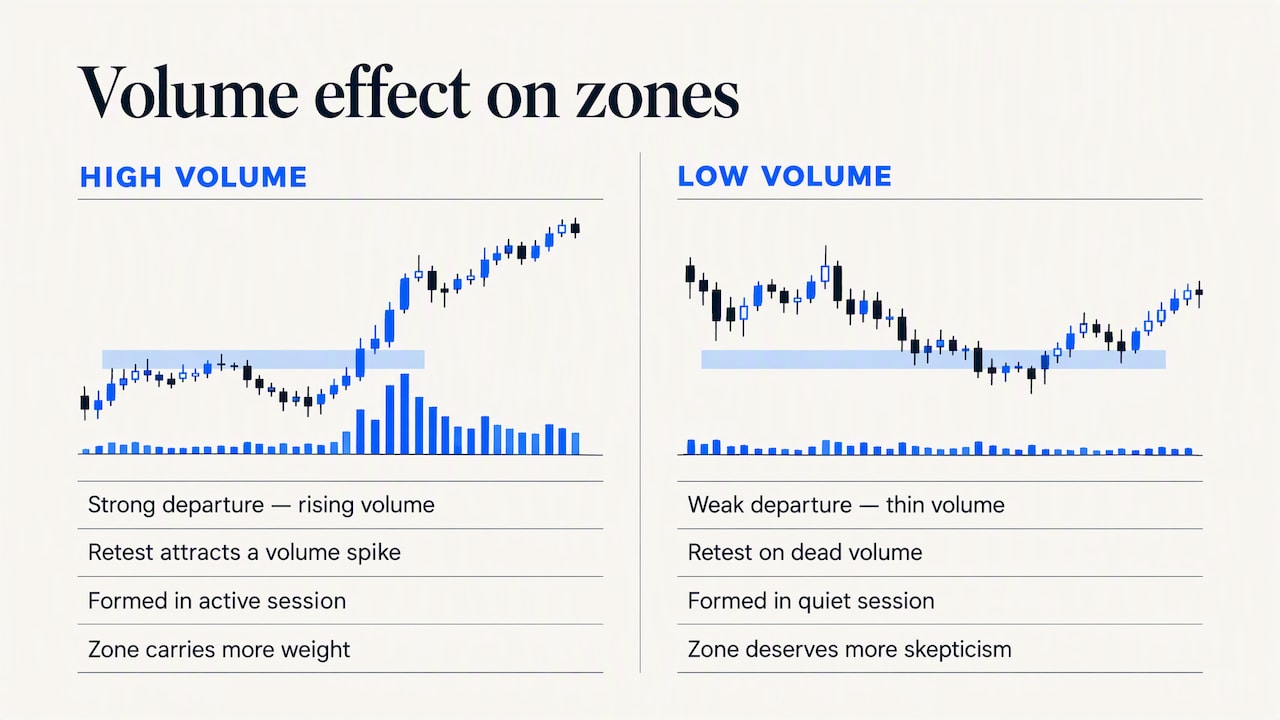
Volume is the closest thing to a lie detector for a zone. A strong departure leg backed by rising volume suggests real buying or selling pressure behind the move, while a weak departure on thin volume suggests the base may not hold up on a retest.
Academic research on chart patterns shows mixed support for their standalone predictive power, but some studies find that patterns are often associated with abnormal volume around the formation and breakout points, suggesting part of their usefulness comes from traders collectively reacting to the same visual signal rather than any hidden mechanical edge. That matters in practice: a zone that attracts a volume spike on its first retest is behaving the way the theory predicts, while a zone that gets touched on dead volume deserves more skepticism.
CME Group’s education on price discovery explains that bids and offers shift continuously as participants react to news and liquidity conditions, which is why the same zone can behave differently depending on the session. A zone that formed during a high-volume session, around a data release or the overlap of major trading hours, generally carries more weight than one that formed in a quiet overnight session with few participants.
Integration of supply and demand zones with other technical indicators
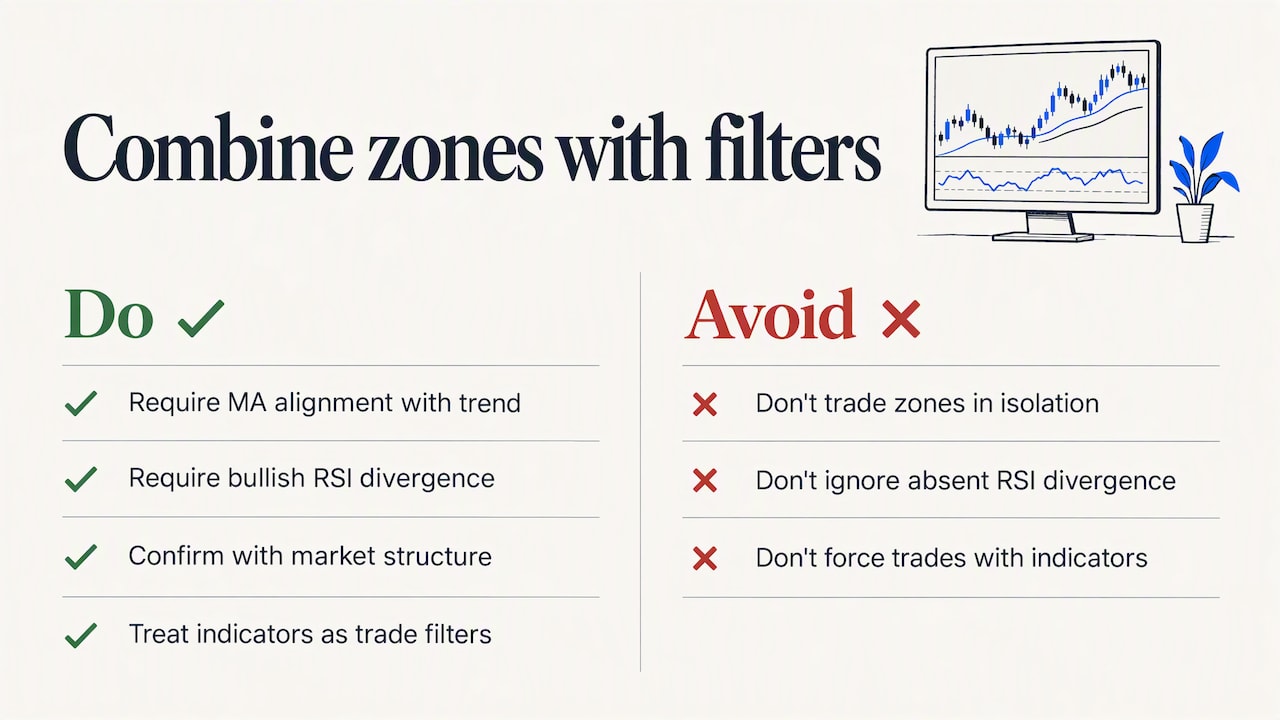
Zones work best as a map, not a complete system, which is why most traders pair them with at least one confirmation layer. Moving averages can confirm whether a zone sits with or against the prevailing trend, and a zone that aligns with a rising 50 or 200-period average carries more weight than one sitting against it.
Momentum tools add a second layer. A bullish divergence on the Relative Strength Index as price taps a demand zone strengthens the case for a long entry, while a lack of divergence is a reason for caution. Market structure itself, the sequence of higher highs and higher lows or the reverse, tells you whether the zone lines up with the broader trend or is fighting it.
Scholarly work on technical analysis finds that some chart-based signals carry statistically significant conditional returns in long historical samples, though results are not universal and depend heavily on context, which is exactly why no single tool, including zones, should be traded in isolation. Treat each additional indicator as a filter that lowers the number of trades you take, not as a way to force more of them.
Risk management strategies specific to trading supply and demand zones
Risk management starts with the zone itself: stop distance and zone width are linked, so a wide, sloppy zone forces either a larger stop or a smaller position. Deciding your maximum acceptable stop size before you look at the chart keeps that decision from being made emotionally in the moment.
CME Group’s price discovery materials note that bid-offer dynamics shift constantly with supply and demand and news flow, a practical reminder that even a well-drawn zone operates inside a market that can reprice quickly. A sensible rule is to risk a fixed, small percentage of the account per trade and to skip any zone whose required stop would push that risk past your limit.
Because retail forex trading carries leverage risk that can produce losses beyond the initial deposit, position sizing should always account for leverage, not just stop distance in price terms. In fast-moving markets, a limit order at the proximal edge gives more control over your entry price than a market order placed after the move has already started.
Why trading zones well depends more on discipline than detection
The hardest part of trading supply and demand zones is not finding them. Most charts have obvious consolidation-and-departure patterns once you know what to look for. The hard part is resisting the urge to trade every single one.
Our view, built from watching how these setups actually play out, is that the traders who struggle with zones are rarely struggling with the drawing rules. They are struggling with patience: skipping the confirmation step, sizing positions as if every zone carries equal odds, or revenge-trading a zone that already failed once. The chart pattern itself is simple. The discipline to wait for the lower-timeframe signal, respect a freshness downgrade, and walk away from a setup that does not meet the checklist is what actually separates consistent results from a string of lucky trades.
— sibca
Where structured signals and coaching fit into zone trading
Drawing zones correctly is only half the job: knowing when a setup is actually ready to trade is where most traders lose time and money. That is the gap a signals subscription is built to close, pairing real-time alerts with the kind of risk guidance that turns a marked zone into a defined trade plan.

Our Forex (monthly) and Crypto & Forex (monthly) plans deliver live alerts and coaching for traders who want ongoing support across sessions, while a Starting Investing plan suits newer traders who want guided signals while they practice zone identification on their own charts. For traders ready to commit long term, Crypto & Forex (Lifetime) removes the recurring subscription step entirely.
- Real-time Telegram alerts flag zone-based setups as they develop, saving screen time.
- One-on-one coaching helps you refine stop placement and position sizing for your own account size.
- Plans cover forex, crypto, or both, allowing you to choose the coverage that fits your trading interests.
Browse the full lineup on our services page and pick the plan that matches how actively you trade.
FAQ
What is a supply and demand zone?
A supply and demand zone is a price range left behind after a period of consolidation followed by a sharp, impulsive move, marking where institutional buy or sell orders were executed. Traders use these ranges, rather than single price lines, to plan entries and stops because the underlying orders were filled across a span of prices, not one exact point.
How do you correctly draw supply and demand zones?
Draw the proximal boundary at the body extreme of the last candle opposing the move and the distal boundary at the furthest wick of the base, keeping the box as tight as possible. A wide, sloppy zone increases your stop distance and lowers your risk-to-reward on every trade you take from it.
What do supply and demand zones look like on a chart?
They appear as a rectangle drawn around a small cluster of consolidating candles, immediately followed by a strong, mostly one-directional move away from that cluster. The pattern typically falls into one of four shapes: rally-base-rally, drop-base-drop, rally-base-drop, or drop-base-rally, depending on the direction before and after the base.
What is the difference between a supply and demand zone and a fair value gap?
A supply and demand zone marks the origin of an impulsive move, the base where orders built up before price departed. A fair value gap is the imbalance left inside the move itself, an inefficient stretch of price with little trading activity, which makes it a faster, more short-term reference point than a zone.
Sources
- Supply And Demand Zones – How to Use it in Forex Trading? | Dukascopy Bank SA
- Chart-pattern and volume research (arXiv preprint)
- Investor Bulletin: Foreign Currency Exchange (Forex) Trading For Individual Investors
- Price Discovery – CME Group